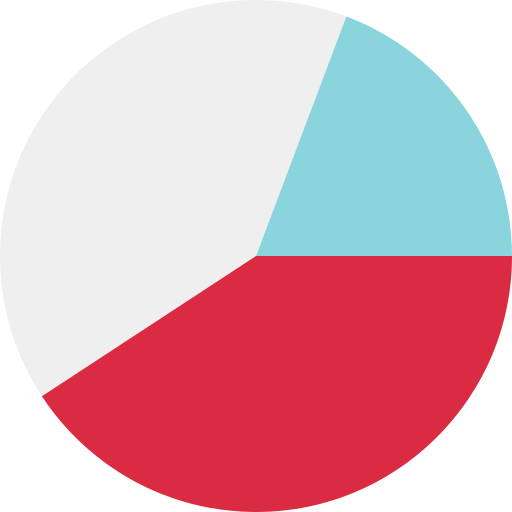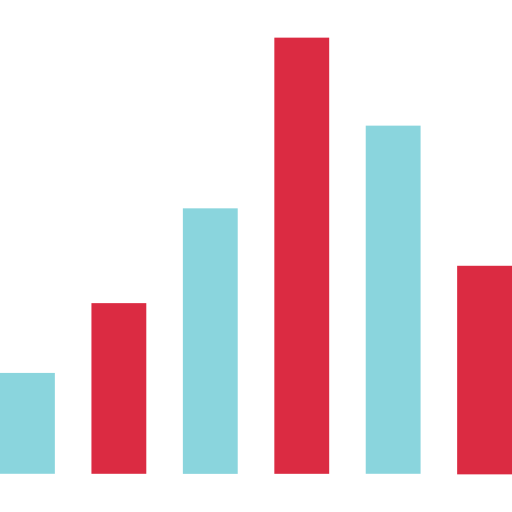
This bar chart graph effectively illustrates comparative data across multiple categories, making it an essential tool for data visualization. The design features clearly defined bars that represent different values, allowing for quick analysis and interpretation of trends. Ideal for presentations, reports, and educational materials, this graphic can be utilized by content creators, marketers, and analysts to convey information succinctly. Its clean and professional aesthetic ensures that it integrates seamlessly into various contexts, whether in digital or print formats, enhancing the overall communication of data-driven insights.
Part of the
Content Creators SVG collection,
in Social.
Download the Bar Chart Graph for Data Visualization vector as a ready-to-edit .svg file —
it scales to any size without losing quality and can be recoloured in any
vector editor or straight in CSS.