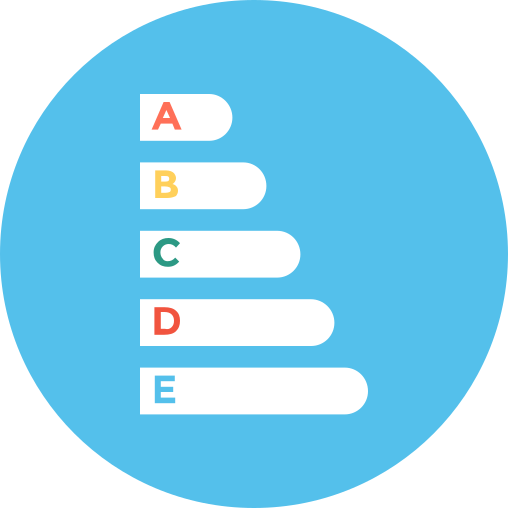
This bar chart visually represents key analytics data pertinent to the energy and power sector. It effectively displays comparative metrics, such as energy consumption, production efficiency, and resource allocation over specific time periods. The design emphasizes clarity and accessibility, making it suitable for presentations, reports, and strategic planning sessions aimed at stakeholders in the energy industry. By illustrating trends and performance indicators, this chart serves as a valuable tool for decision-makers to identify areas for improvement and optimize energy management strategies.


Part of the
Energy & Power SVG collection,
in Energy.
Download the Energy Sector Analytics Bar Chart vector as a ready-to-edit .svg file —
it scales to any size without losing quality and can be recoloured in any
vector editor or straight in CSS.