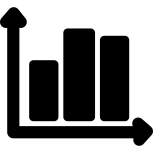
This graphic features a series of vertical bars, visually representing data in a clear and concise manner. Each bar varies in height, indicating different values or quantities, making it an effective tool for illustrating comparisons among multiple datasets. Ideal for educational materials, presentations, and reports, this image serves as a versatile resource for teachers, students, and professionals in the field of mathematics and data analysis. Its clean design allows for easy integration into various contexts, whether for academic purposes or business analytics, facilitating a better understanding of statistical information.
Part of the
Mathbert Mathematics SVG collection,
in Science.
Download the Mathematical Bar Graph Representation vector as a ready-to-edit .svg file —
it scales to any size without losing quality and can be recoloured in any
vector editor or straight in CSS.