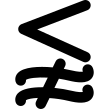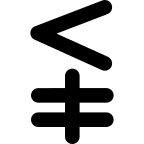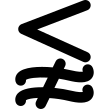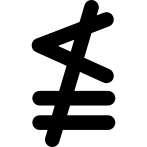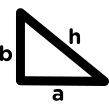
This illustration provides a comprehensive overview of key trigonometric functions, including sine, cosine, and tangent, along with their corresponding graphs. The design effectively visualizes the periodic nature of these functions, highlighting their amplitude, frequency, and phase shifts. Ideal for educational purposes, this image can be utilized in mathematics textbooks, online courses, and tutoring materials to aid students in understanding the fundamental concepts of trigonometry. Additionally, it serves as a valuable reference for educators preparing lessons or presentations on the topic, making complex ideas more accessible through visual representation.
Part of the
Mathbert Mathematics SVG collection,
in Science.
Download the Trigonometric Functions and Graphs vector as a ready-to-edit .svg file —
it scales to any size without losing quality and can be recoloured in any
vector editor or straight in CSS.