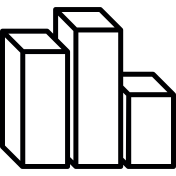
This 3D bar chart visualization effectively represents quantitative data in a visually engaging format. The chart features multiple bars, each varying in height and color, allowing for easy comparison of different data sets. Ideal for presentations, reports, and dashboards, this graphic can be utilized in various fields such as business analytics, market research, and educational materials. The three-dimensional perspective adds depth, making it suitable for highlighting trends and performance metrics in a more dynamic way. Use this chart to enhance your data storytelling and provide clear insights to your audience.
Part of the
Real Assets SVG collection,
in Home.
Download the 3D Bar Chart Visualization vector as a ready-to-edit .svg file —
it scales to any size without losing quality and can be recoloured in any
vector editor or straight in CSS.