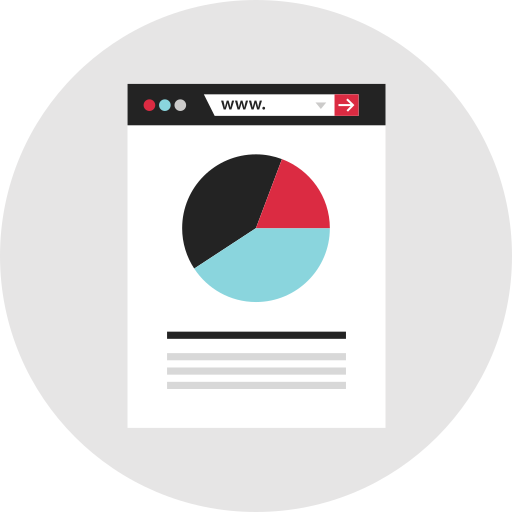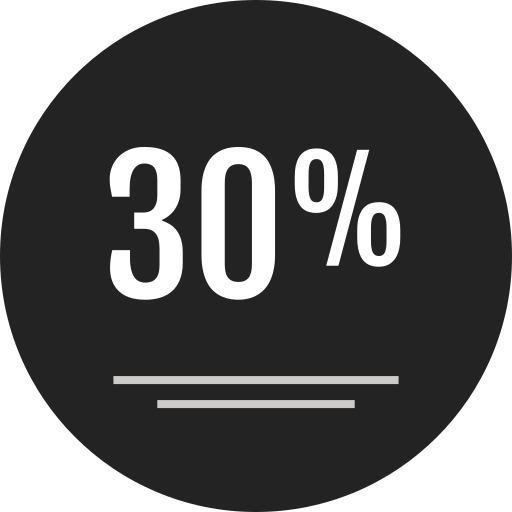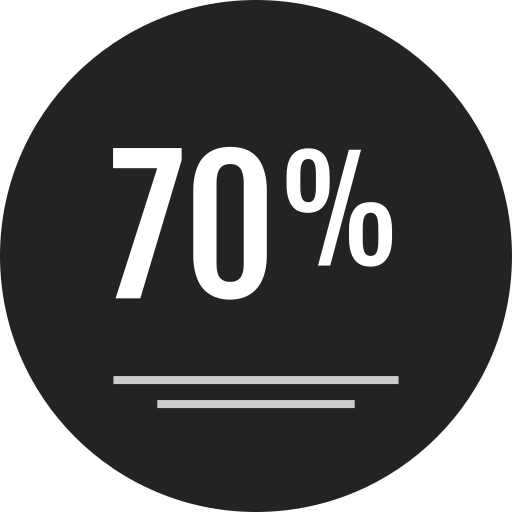
This infographic presents a visually engaging item performance chart that categorizes and compares various products or services labeled as 'ABC'. The chart utilizes a clear and structured layout, featuring distinct color-coded sections for each item, making it easy to interpret data at a glance. Ideal for business presentations, marketing materials, or analytical reports, this chart can effectively communicate key performance indicators, trends, and insights related to the ABC items. Its design is suitable for both digital and print formats, enhancing the clarity of information for stakeholders, team members, or clients. Use this chart to facilitate discussions, support decision-making processes, or showcase product performance in a professional setting.


Part of the
Infographics SVG collection,
in Design.
Download the ABC Item Performance Chart vector as a ready-to-edit .svg file —
it scales to any size without losing quality and can be recoloured in any
vector editor or straight in CSS.