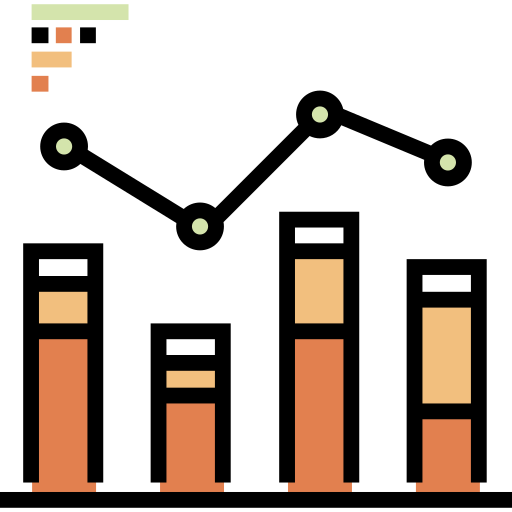
This graphic features a dual-axis chart that integrates both bar and line chart elements, providing a comprehensive visualization of data trends and comparisons. The bar chart effectively displays categorical data, allowing for easy comparison between different groups or time periods, while the line chart overlays continuous data trends, highlighting changes over time. This design is particularly useful for business presentations, financial reports, and data analysis, enabling viewers to quickly grasp complex information and make informed decisions. Ideal for use in dashboards, marketing materials, and analytical reports, this combined chart serves as a powerful tool for conveying insights in a visually appealing manner.

Part of the
Business SVG collection,
in Business.
Download the Combined Bar and Line Chart Visualization vector as a ready-to-edit .svg file —
it scales to any size without losing quality and can be recoloured in any
vector editor or straight in CSS.