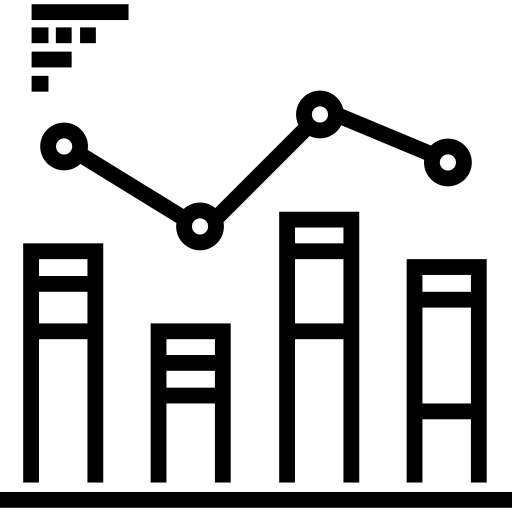
This image features a combined bar and line chart, designed to effectively display and compare two different sets of data within a single visual framework. The bar chart component allows for easy interpretation of categorical data, showcasing individual values with distinct vertical bars, while the line chart overlays this information to illustrate trends over time or continuous data points. This dual representation is particularly useful in business analytics, financial reporting, and performance tracking, enabling stakeholders to quickly grasp relationships between datasets, identify trends, and make informed decisions. Ideal for presentations, reports, and dashboards, this visualization enhances data storytelling by providing a clear and comprehensive view of complex information.

Part of the
Business SVG collection,
in Business.
Download the Combined Bar and Line Chart Visualization vector as a ready-to-edit .svg file —
it scales to any size without losing quality and can be recoloured in any
vector editor or straight in CSS.