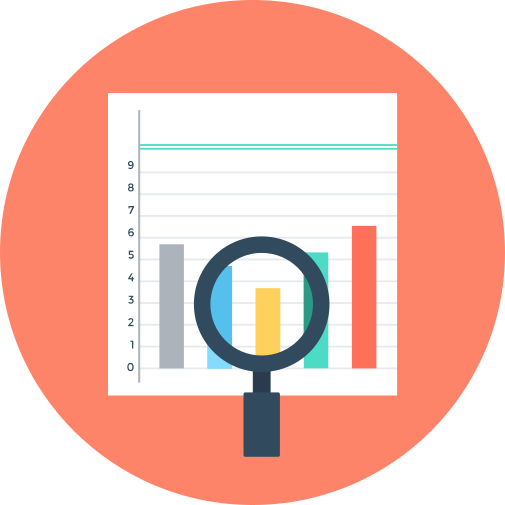
This image serves as a detailed representation of analytics and statistics, showcasing various data visualization techniques such as bar graphs, pie charts, and line graphs. It is designed to provide a clear and engaging overview of key performance indicators and trends, making it an essential tool for data analysis and reporting. The visual elements are strategically arranged to facilitate quick comprehension of complex data sets, making it ideal for presentations, business reports, and educational materials. Users can leverage this illustration to enhance their understanding of data-driven insights and communicate findings effectively to stakeholders.

Part of the
Reports & Analytics SVG collection,
in Business.
Download the Comprehensive Analytics and Statistics Visualization vector as a ready-to-edit .svg file —
it scales to any size without losing quality and can be recoloured in any
vector editor or straight in CSS.