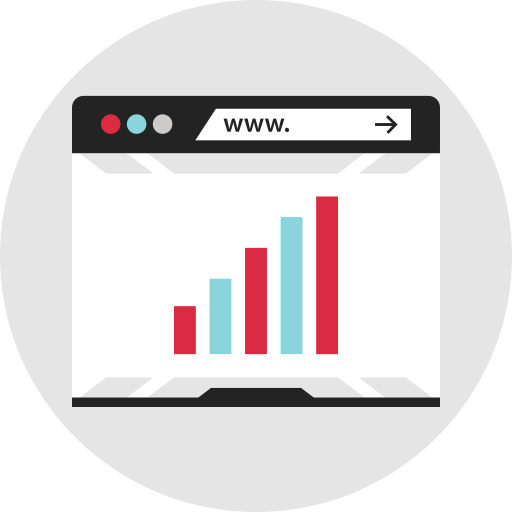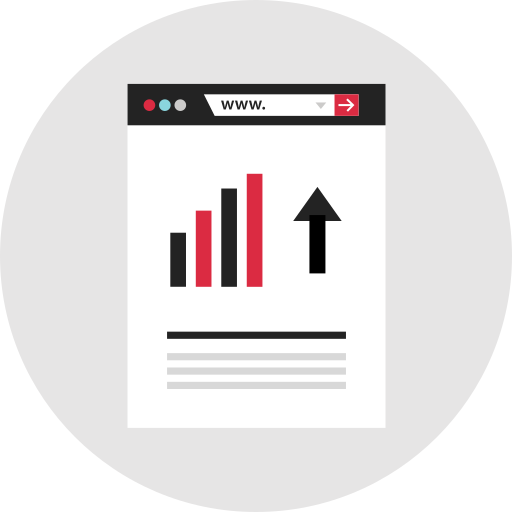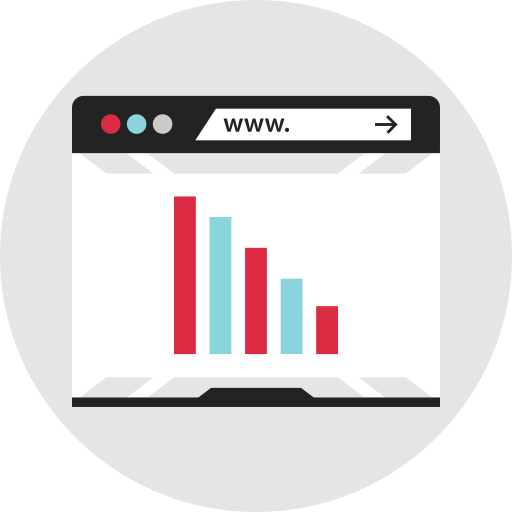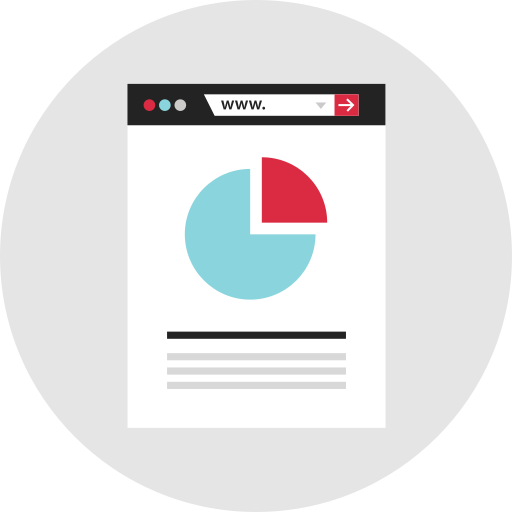
This infographic presents a visually engaging representation of analytics data, designed to simplify complex information and enhance understanding. It features a variety of charts, graphs, and icons that illustrate key metrics and trends, making it an ideal resource for businesses, educators, and marketers looking to convey analytical insights effectively. The design emphasizes clarity and accessibility, allowing viewers to quickly grasp essential data points and their implications. This infographic can be utilized in presentations, reports, or digital content to support data-driven decision-making and facilitate discussions around performance metrics and strategic planning.



Part of the
Infographics SVG collection,
in Design.
Download the Comprehensive Analytics Infographic vector as a ready-to-edit .svg file —
it scales to any size without losing quality and can be recoloured in any
vector editor or straight in CSS.