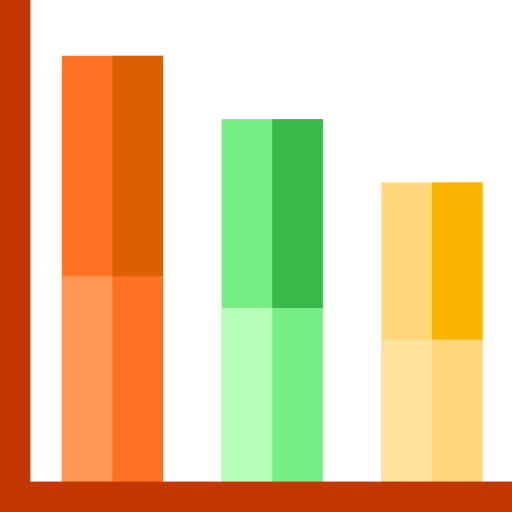
This bar chart visualization effectively represents quantitative data across multiple categories, making it an ideal tool for financial analysis and reporting. The chart features distinct bars that vary in height, allowing for quick comparisons of values, trends, and performance metrics. Its clean and modern design enhances readability, making it suitable for presentations, reports, and dashboards in finance-related contexts. The chart can be easily adapted to display various datasets, such as revenue growth, expense distribution, or market share analysis, providing valuable insights for decision-making and strategic planning.


Part of the
Finance SVG collection,
in Finance.
Download the Dynamic Bar Chart Visualization vector as a ready-to-edit .svg file —
it scales to any size without losing quality and can be recoloured in any
vector editor or straight in CSS.