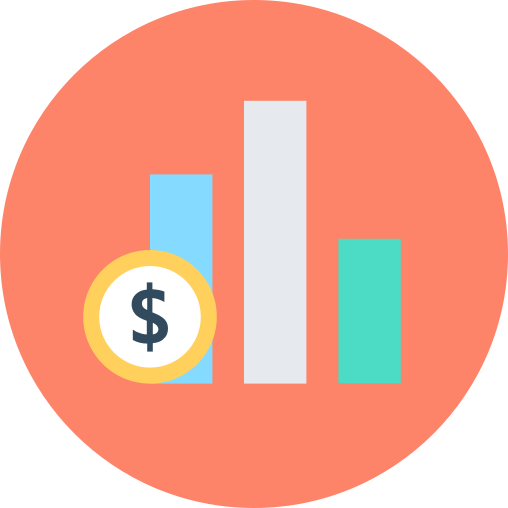
This bar chart graphic serves as a powerful visual tool for representing quantitative data in a clear and engaging manner. Ideal for financial reports, presentations, and data analysis, the chart effectively illustrates comparisons among different categories or time periods. The design features distinct bars that can be easily customized in terms of color and scale, allowing users to highlight specific data points or trends. This graphic is particularly useful for finance professionals, marketers, and educators looking to convey information succinctly and visually, enhancing audience understanding and retention of complex data sets.


Part of the
Finance SVG collection,
in Finance.
Download the Dynamic Bar Chart Visualization vector as a ready-to-edit .svg file —
it scales to any size without losing quality and can be recoloured in any
vector editor or straight in CSS.