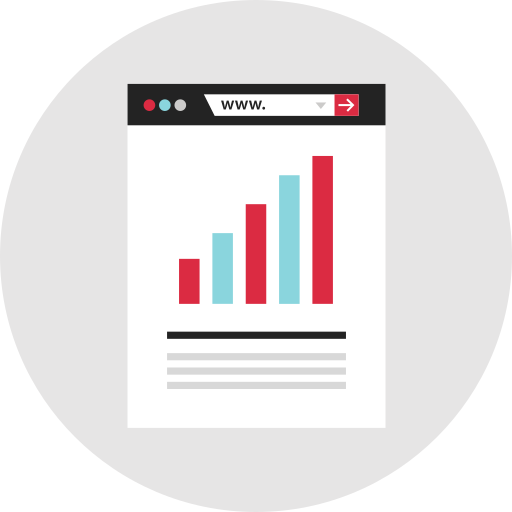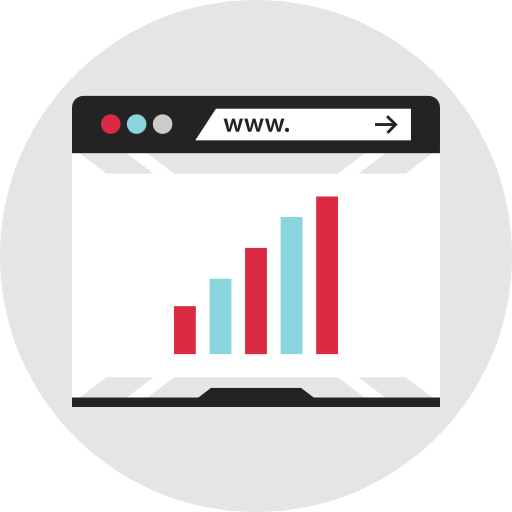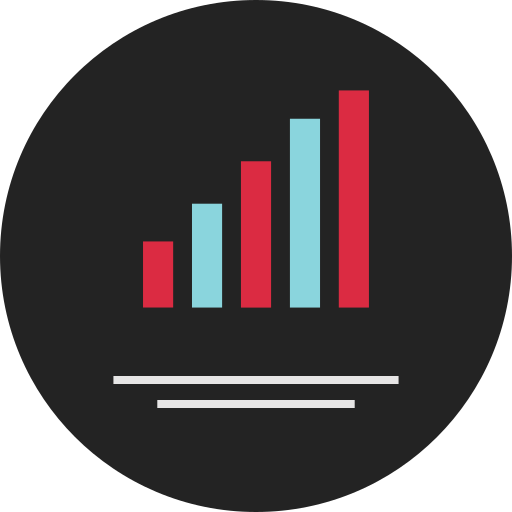
This visually engaging bar graph serves as an effective tool for presenting comparative data across various categories. Ideal for business reports, academic presentations, or marketing materials, the graph allows users to easily interpret trends and differences in data sets. With its clean lines and distinct color palette, it enhances the clarity of information, making it suitable for both professional and educational contexts. The design can be customized to reflect specific data points, making it versatile for a range of applications, from financial analysis to survey results, ensuring that audiences grasp the key insights at a glance.

Part of the
Infographics SVG collection,
in Design.
Download the Dynamic Bar Graph Representation vector as a ready-to-edit .svg file —
it scales to any size without losing quality and can be recoloured in any
vector editor or straight in CSS.