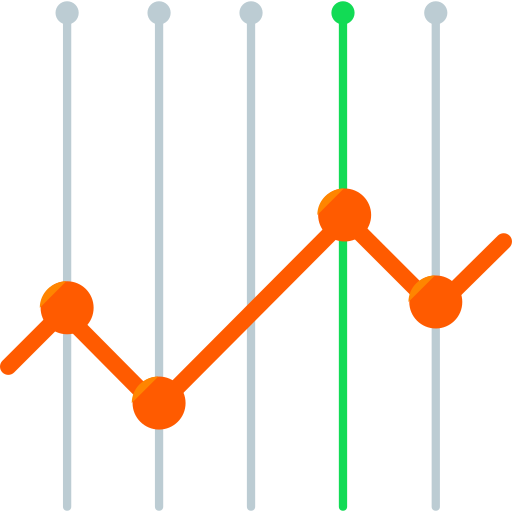
This line chart visually represents financial data trends over a specified period, showcasing key metrics such as revenue growth, expenses, or stock prices. The chart features a clean and modern design, making it easy to interpret fluctuations and patterns in the data. Ideal for presentations, reports, or dashboards, this graphic can be utilized by financial analysts, business managers, and investors to communicate insights effectively. The use of distinct colors and markers enhances clarity, allowing viewers to quickly grasp the performance trajectory of the financial variables being analyzed.



Part of the
Finance SVG collection,
in Finance.
Download the Dynamic Financial Line Chart vector as a ready-to-edit .svg file —
it scales to any size without losing quality and can be recoloured in any
vector editor or straight in CSS.