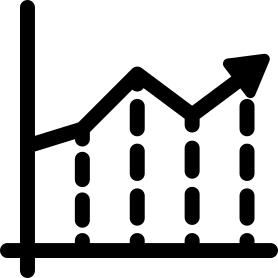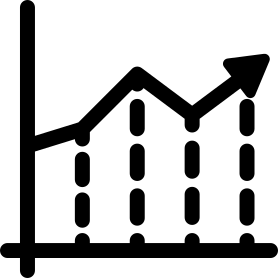
This line graph visually represents data trends over a specified period, showcasing the performance metrics relevant to startups and new businesses. The graph features a clean, outlined design, making it easy to interpret fluctuations in data points, such as revenue growth, user acquisition rates, or market expansion. Its minimalist aesthetic ensures that it can be seamlessly integrated into presentations, reports, or digital platforms aimed at entrepreneurs and investors. This versatile graphic can be utilized in business plans, pitch decks, or educational materials to effectively communicate analytical insights and support data-driven decision-making.


Part of the
Startups & New Business Outlined SVG collection,
in Business.
Download the Dynamic Line Graph Representation vector as a ready-to-edit .svg file —
it scales to any size without losing quality and can be recoloured in any
vector editor or straight in CSS.