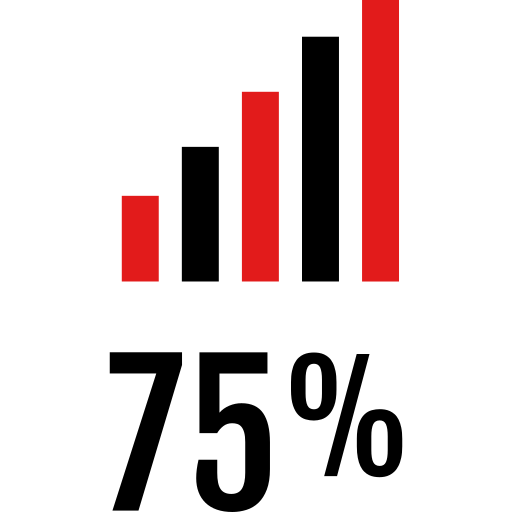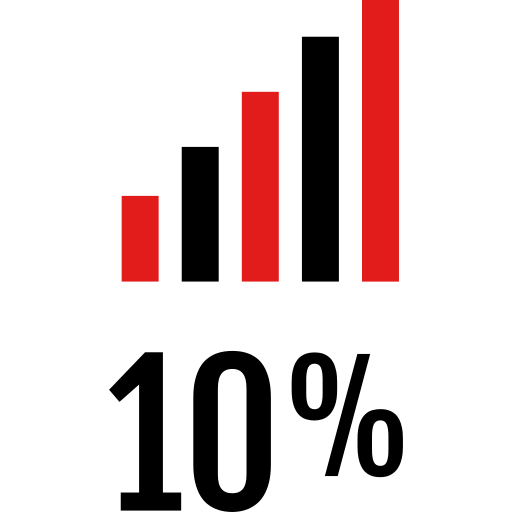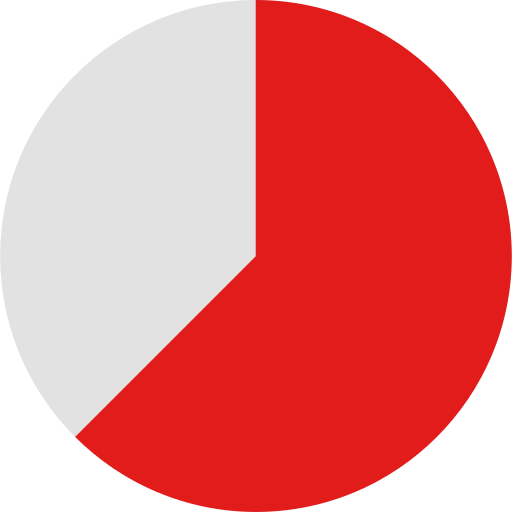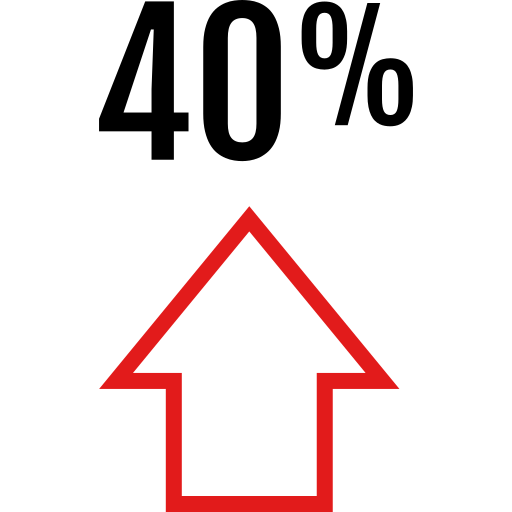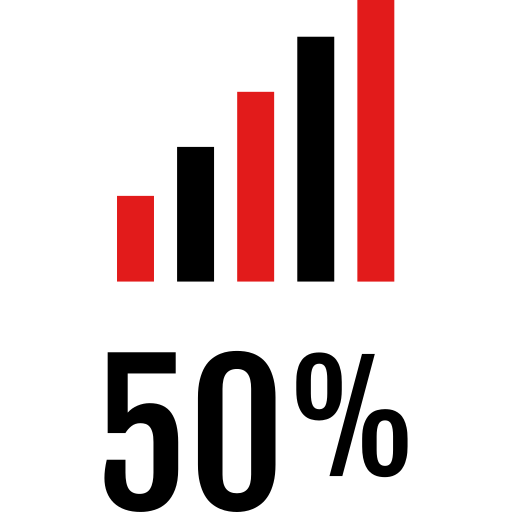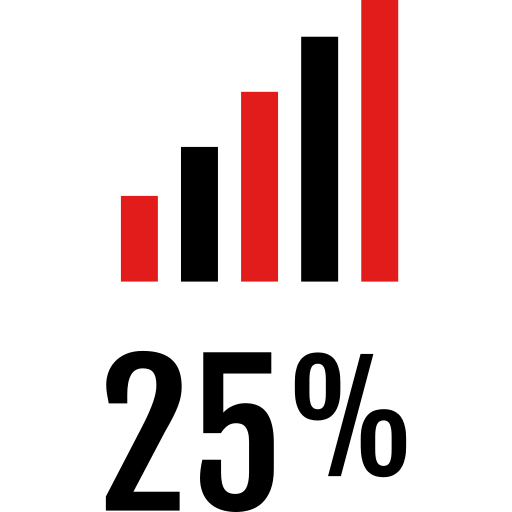
This image features a dynamic statistical graph designed to visually represent data trends and comparisons. The graph utilizes vibrant colors and clear labeling to enhance readability and engagement, making it suitable for presentations, reports, and educational materials. Its design allows for easy interpretation of complex data sets, making it an ideal choice for analysts, educators, and business professionals looking to convey information effectively. The graph can be adapted for various contexts, including financial analysis, market research, and performance tracking, ensuring that users can tailor it to their specific needs.

Part of the
Info Graphics Red SVG collection,
in Business.
Download the Dynamic Statistical Graph Representation vector as a ready-to-edit .svg file —
it scales to any size without losing quality and can be recoloured in any
vector editor or straight in CSS.