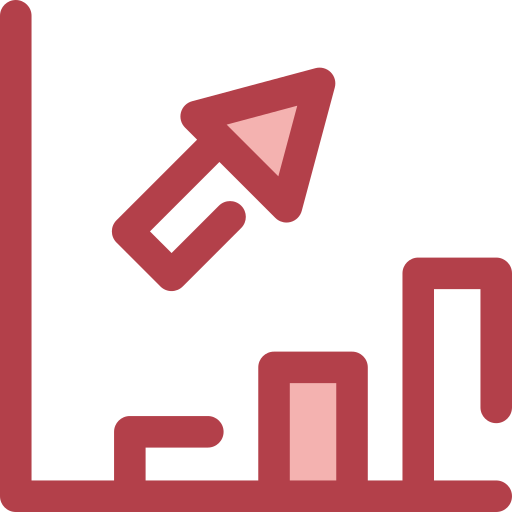
This bar chart visually represents employee performance metrics within an organization. Each bar corresponds to a specific employee or team, showcasing key performance indicators such as productivity, sales figures, or project completion rates. The design is clean and professional, making it suitable for presentations, reports, or dashboards aimed at HR departments, team leaders, or organizational analysts. The chart effectively communicates data trends and comparisons, allowing stakeholders to quickly assess individual and team performance, identify areas for improvement, and make informed decisions regarding employee development and resource allocation.

Part of the
Employees Organization SVG collection,

in Business.
Download the Employee Performance Bar Chart vector as a ready-to-edit .svg file —
it scales to any size without losing quality and can be recoloured in any
vector editor or straight in CSS.