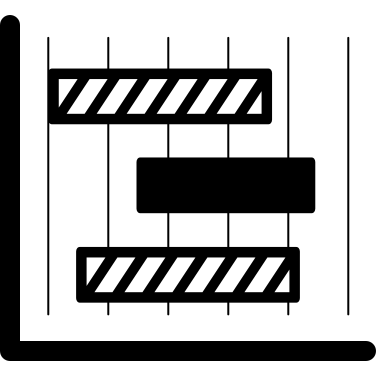
This horizontal bars chart visually represents data comparisons across multiple categories, making it an effective tool for displaying quantitative information. The design features clearly defined bars that allow for easy interpretation of values, with each bar's length corresponding to its respective data point. This type of chart is particularly useful in business presentations, reports, and analytics dashboards, where stakeholders need to quickly grasp performance metrics, survey results, or sales figures. Its straightforward layout enhances readability, making it suitable for audiences of varying expertise levels. The horizontal orientation is ideal for accommodating long category labels, ensuring clarity and accessibility in data communication.


Part of the
Business Chart Pictograms SVG collection,
in Business.
Download the Horizontal Bars Chart vector as a ready-to-edit .svg file —
it scales to any size without losing quality and can be recoloured in any
vector editor or straight in CSS.