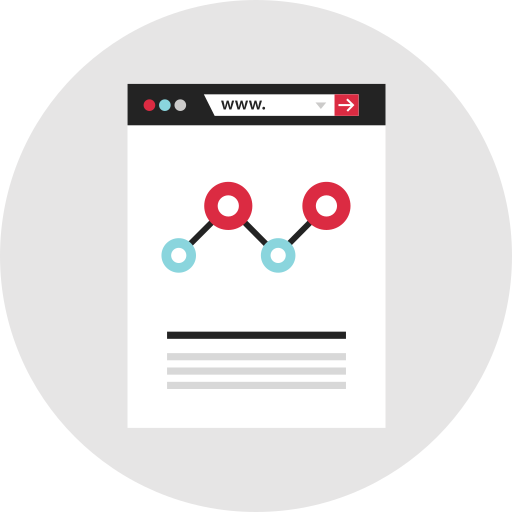
This line and dot chart visualization effectively illustrates data trends over time, combining the clarity of line graphs with the precision of dot markers. The design is ideal for presenting quantitative information, making it suitable for reports, presentations, and dashboards in various fields such as finance, marketing, and research. The chart allows viewers to easily identify patterns, fluctuations, and key data points, enhancing data comprehension and decision-making processes. Its clean and professional aesthetic ensures that it can be seamlessly integrated into both digital and print materials, making it a versatile tool for data-driven storytelling.

Part of the
Infographics SVG collection,
in Design.
Download the Line and Dot Chart Visualization vector as a ready-to-edit .svg file —
it scales to any size without losing quality and can be recoloured in any
vector editor or straight in CSS.