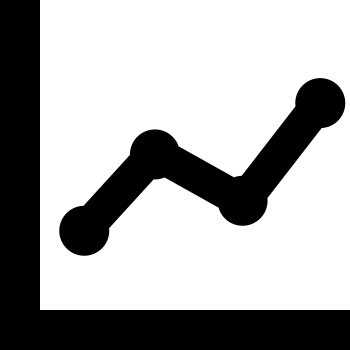
This line and dot chart visualization effectively represents data trends over time, making it an essential tool for analysts and researchers. The combination of lines and dots allows for a clear depiction of data points, highlighting both the overall trend and specific values. This chart is ideal for presentations, reports, and dashboards where conveying complex information in an easily digestible format is crucial. It can be utilized in various fields, including finance, marketing, and scientific research, to illustrate changes in metrics such as sales figures, website traffic, or experimental results. The design is clean and professional, ensuring that it integrates seamlessly into any infographic or data visualization project.

Part of the
Infographics SVG collection,
in Design.
Download the Line and Dot Chart Visualization vector as a ready-to-edit .svg file —
it scales to any size without losing quality and can be recoloured in any
vector editor or straight in CSS.