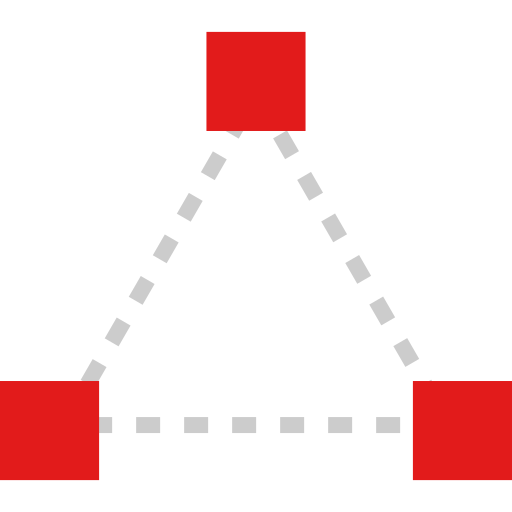
This graphic illustrates a complex network of interconnected nodes, designed to represent relationships and data flow within a system. The nodes vary in size and color, symbolizing different types of entities or data points, while the connecting lines demonstrate the interactions and pathways between them. This visualization is particularly useful in fields such as data analysis, software architecture, and project management, where understanding the dynamics of interconnected elements is crucial. It can be employed in presentations, reports, or educational materials to effectively communicate complex concepts in a visually engaging manner.


Part of the
Creative Process SVG collection,
in Design.
Download the Node Network Visualization vector as a ready-to-edit .svg file —
it scales to any size without losing quality and can be recoloured in any
vector editor or straight in CSS.