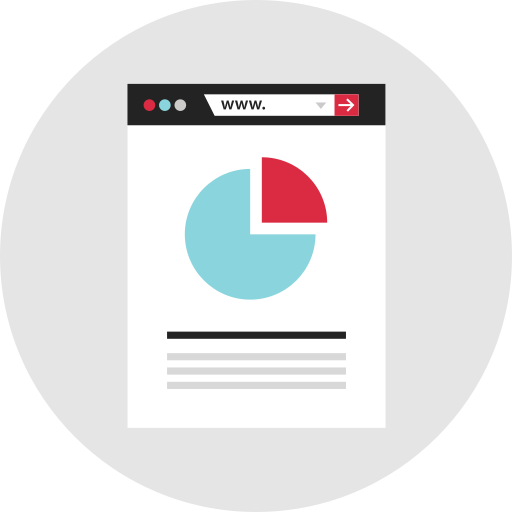
This percentage chart provides a clear and visually appealing representation of data distribution across various categories. Designed for use in infographics, reports, and presentations, it effectively communicates the proportions of different segments in relation to a whole. The chart can be customized to fit diverse themes and color schemes, making it suitable for business analytics, educational materials, and marketing strategies. Its intuitive design allows viewers to quickly grasp key insights, making it an essential tool for data-driven decision-making and storytelling.


Part of the
Infographics SVG collection,
in Design.
Download the Percentage Chart Visualization vector as a ready-to-edit .svg file —
it scales to any size without losing quality and can be recoloured in any
vector editor or straight in CSS.