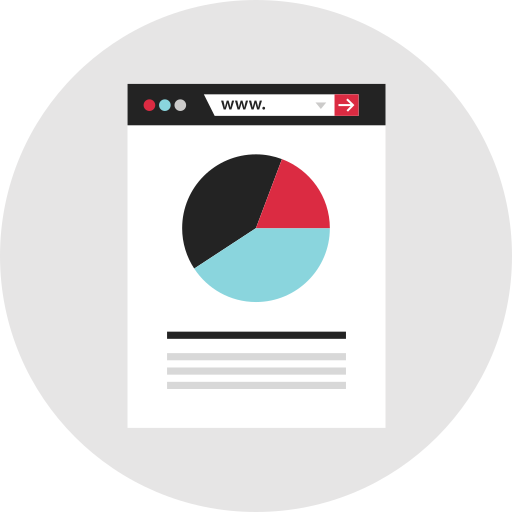
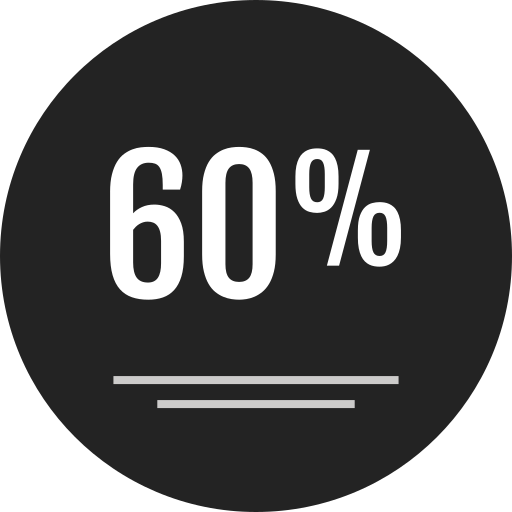
This percentage chart visualization effectively illustrates data distribution in a clear and engaging manner. Designed to convey complex information at a glance, it utilizes segments to represent different portions of a whole, making it ideal for presentations, reports, and educational materials. The chart can be customized to reflect various data sets, such as survey results, budget allocations, or demographic statistics, enhancing its versatility for business analysts, educators, and marketers. Its clean design ensures that key insights are easily discernible, facilitating informed decision-making and effective communication of data-driven narratives.


Part of the
Infographics SVG collection,
in Design.
Download the Percentage Chart Visualization vector as a ready-to-edit .svg file —
it scales to any size without losing quality and can be recoloured in any
vector editor or straight in CSS.