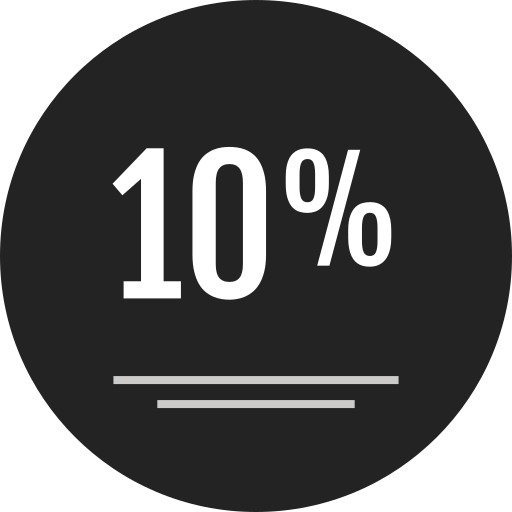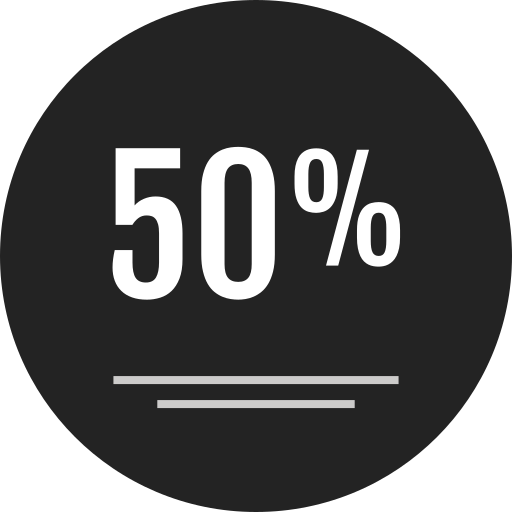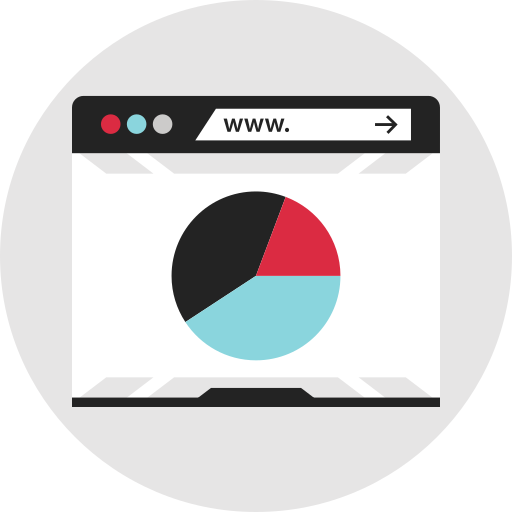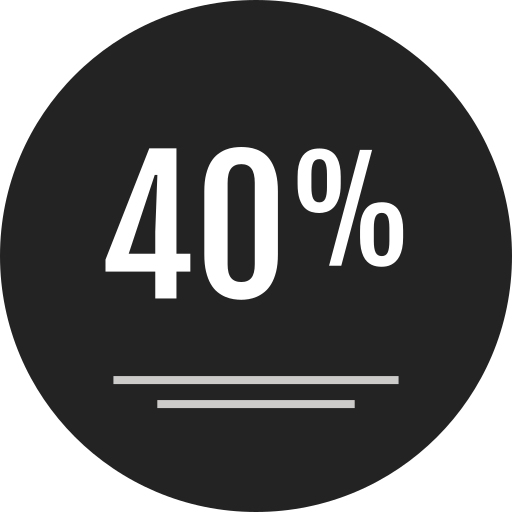
This percentage chart provides a clear and visually appealing representation of data distribution across various categories. Ideal for business presentations, reports, and educational materials, the chart effectively communicates the proportions of different segments, making it easier for audiences to grasp complex information at a glance. Its design can be customized to fit various themes, allowing users to highlight key data points and trends. This chart is particularly useful for illustrating survey results, market analysis, and performance metrics, enhancing the overall impact of data-driven storytelling.


Part of the
Infographics SVG collection,
in Design.
Download the Percentage Chart Visualization vector as a ready-to-edit .svg file —
it scales to any size without losing quality and can be recoloured in any
vector editor or straight in CSS.