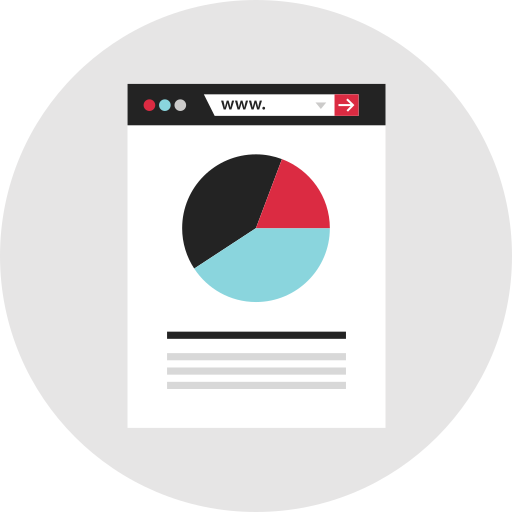
This visually engaging pie chart illustrates data distribution through distinct segments, each representing a specific category or value. The accompanying connection lines enhance the chart's clarity by linking segments to relevant data points or explanations, making it easier for viewers to understand relationships and comparisons. Ideal for use in business presentations, reports, or educational materials, this graphic effectively communicates statistical information in a concise and visually appealing manner, aiding in data analysis and decision-making processes.

Part of the
Infographics SVG collection,
in Design.
Download the Pie Chart with Connection Lines vector as a ready-to-edit .svg file —
it scales to any size without losing quality and can be recoloured in any
vector editor or straight in CSS.