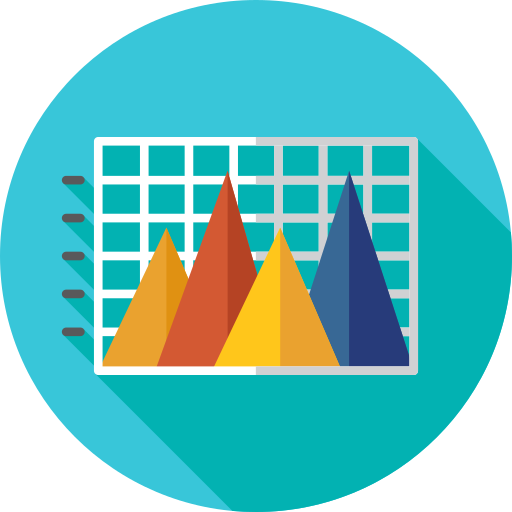
This pyramid chart visually represents hierarchical data, illustrating the relationship between different levels of information. The design typically features a triangular structure, with the broadest section at the base indicating the largest group or category, tapering to a point at the top that signifies the smallest or most specialized segment. This type of chart is particularly effective for showcasing concepts such as population distribution, organizational structures, or product sales across various tiers. It can be utilized in presentations, reports, and educational materials to facilitate understanding of complex data in a clear and engaging manner.

Part of the
Charts & Diagrams SVG collection,
in Business.
Download the Pyramid Chart Representation vector as a ready-to-edit .svg file —
it scales to any size without losing quality and can be recoloured in any
vector editor or straight in CSS.