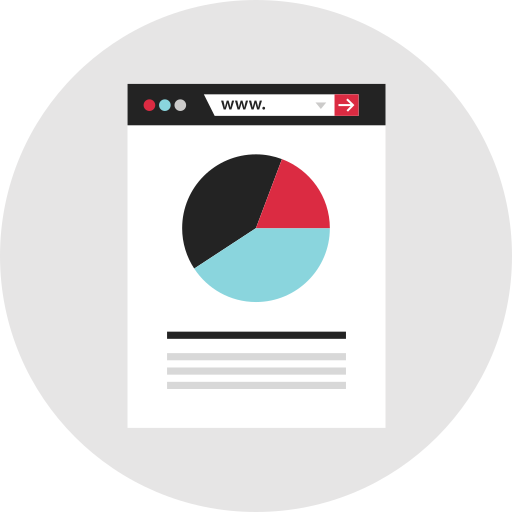
This visually engaging segmented portion pie chart effectively illustrates data distribution across multiple categories. Each slice of the pie represents a specific portion of the whole, allowing for quick visual analysis of relative sizes and comparisons. The chart is designed with distinct colors and clear labels, making it suitable for presentations, reports, and educational materials. Ideal for business analysts, marketers, and educators, this infographic can be used to convey statistical information, track performance metrics, or display survey results, enhancing audience understanding and retention of complex data.

Part of the
Infographics SVG collection,
in Design.
Download the Segmented Portion Pie Chart vector as a ready-to-edit .svg file —
it scales to any size without losing quality and can be recoloured in any
vector editor or straight in CSS.