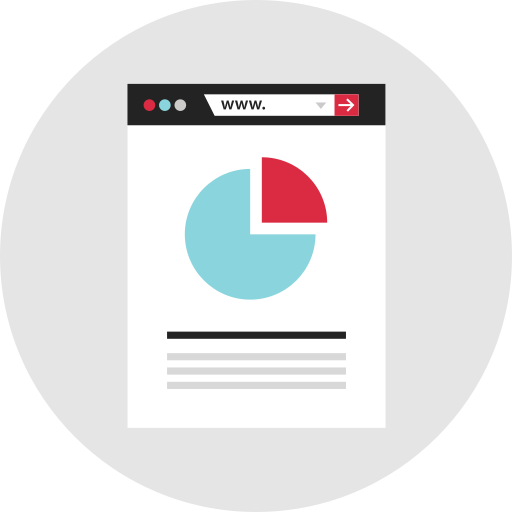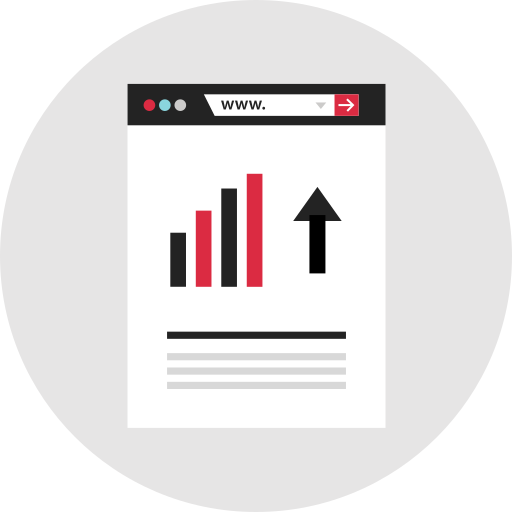
This infographic presents a visually engaging overview of analytics concepts, making complex data easily digestible. It features a blend of charts, graphs, and icons that illustrate key performance indicators, data trends, and analytical processes. Designed for professionals in data science, marketing, and business intelligence, this infographic serves as an educational tool to enhance presentations, reports, and digital content. Its clear layout and vibrant colors not only capture attention but also facilitate better understanding of analytics, making it suitable for use in workshops, seminars, and online courses.


Part of the
Infographics SVG collection,
in Design.
Download the Comprehensive Analytics Infographic vector as a ready-to-edit .svg file —
it scales to any size without losing quality and can be recoloured in any
vector editor or straight in CSS.