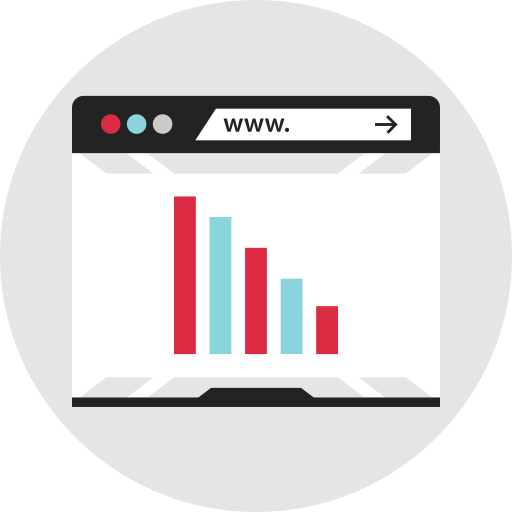
This dual information bar chart visually represents two sets of related data, allowing for easy comparison and analysis. The design features two distinct sets of bars, each labeled for clarity, making it suitable for showcasing trends, performance metrics, or survey results across different categories. Ideal for use in business presentations, academic reports, and infographics, this chart effectively communicates complex information in a straightforward manner. Its clean layout and contrasting colors enhance readability, ensuring that viewers can quickly grasp the key insights being presented. This versatile graphic can be adapted for various industries, including finance, marketing, and education, making it a valuable tool for data visualization.

Part of the
Infographics SVG collection,
in Design.
Download the Dual Information Bar Chart vector as a ready-to-edit .svg file —
it scales to any size without losing quality and can be recoloured in any
vector editor or straight in CSS.