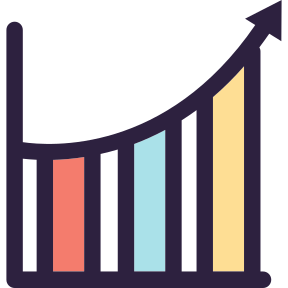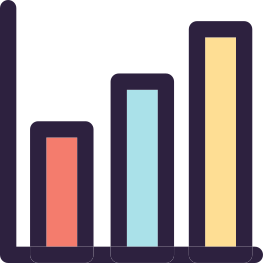
This bar chart visualization effectively represents quantitative data through vertical bars, making it easy to compare different categories at a glance. Each bar's height corresponds to its value, allowing for immediate visual analysis of trends and disparities. Ideal for presentations, reports, or dashboards, this graphic can be used in various contexts such as business analytics, educational materials, or market research. The clean design ensures clarity and professionalism, making it suitable for both digital and print formats.

Part of the
Graph SVG collection,
in Business.
Download the Dynamic Bar Chart Visualization vector as a ready-to-edit .svg file —
it scales to any size without losing quality and can be recoloured in any
vector editor or straight in CSS.