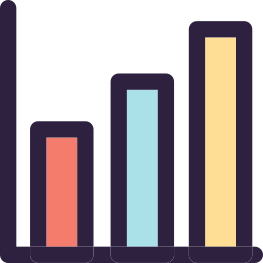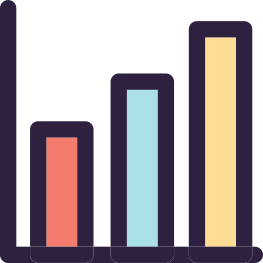
This bar chart visualization effectively represents quantitative data across various categories, making it an essential tool for data analysis and presentation. The chart features distinct bars, each color-coded to enhance clarity and facilitate comparison between different data points. It is suitable for use in business reports, academic presentations, and data-driven storytelling, allowing users to easily identify trends, patterns, and outliers within the dataset. The design is clean and modern, ensuring that it integrates seamlessly into digital platforms or printed materials, making it an ideal choice for professionals seeking to communicate data insights effectively.

Part of the
Graph SVG collection,
in Business.
Download the Dynamic Bar Chart Visualization vector as a ready-to-edit .svg file —
it scales to any size without losing quality and can be recoloured in any
vector editor or straight in CSS.