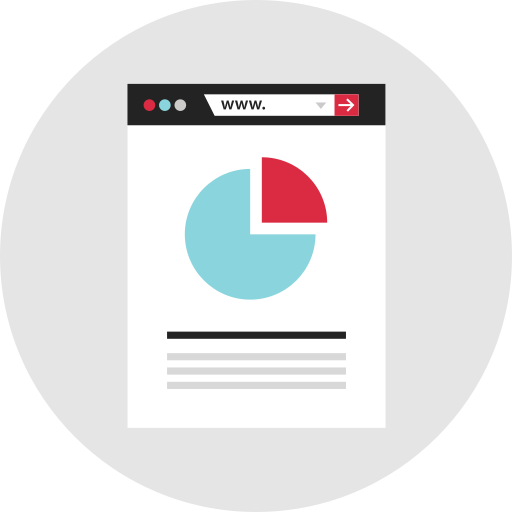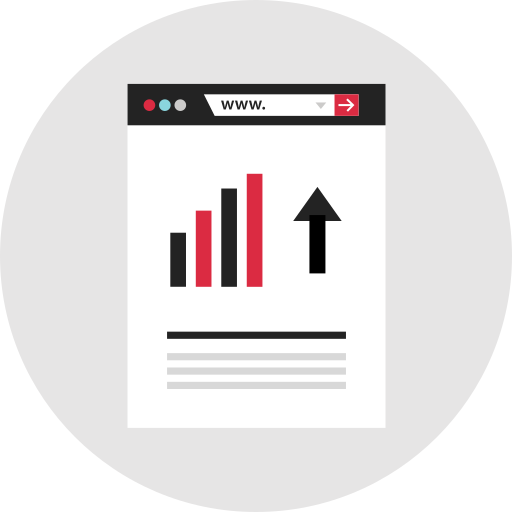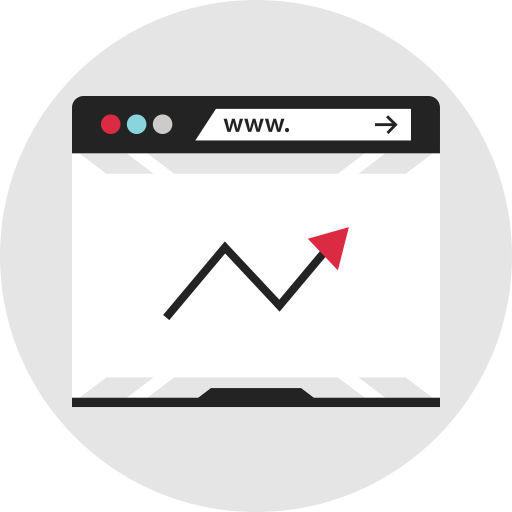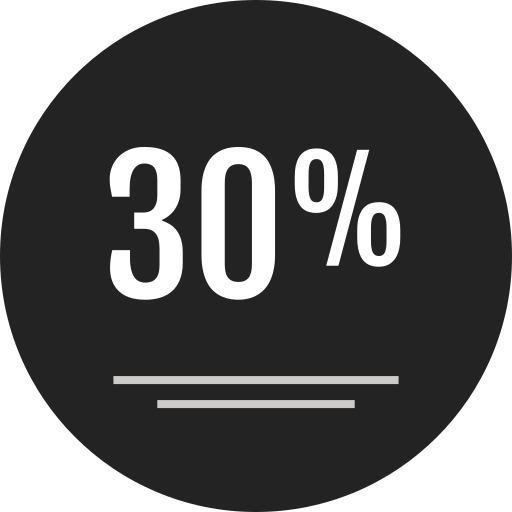
This visually engaging percentage chart effectively illustrates data distribution and comparative analysis, making it an essential tool for presentations, reports, and infographics. Designed to convey complex information in a clear and concise manner, it allows users to easily interpret percentages and trends at a glance. Ideal for business analysts, marketers, and educators, this chart can be utilized in various contexts such as financial reports, market research, and educational materials to enhance understanding and facilitate data-driven decision-making. Its customizable features enable users to adapt colors and styles to fit their branding or thematic needs, ensuring versatility across different platforms and audiences.

Part of the
Infographics SVG collection,
in Design.
Download the Dynamic Percentage Chart vector as a ready-to-edit .svg file —
it scales to any size without losing quality and can be recoloured in any
vector editor or straight in CSS.