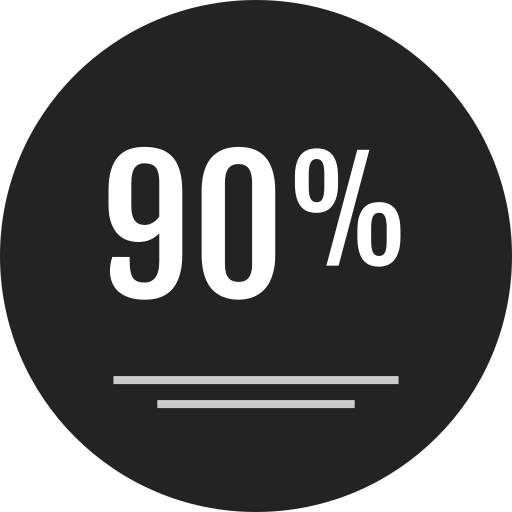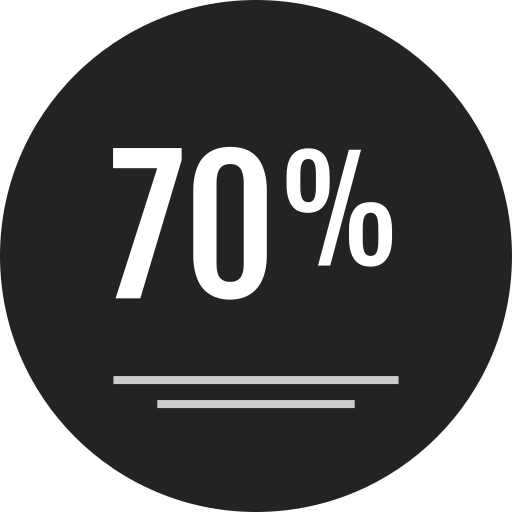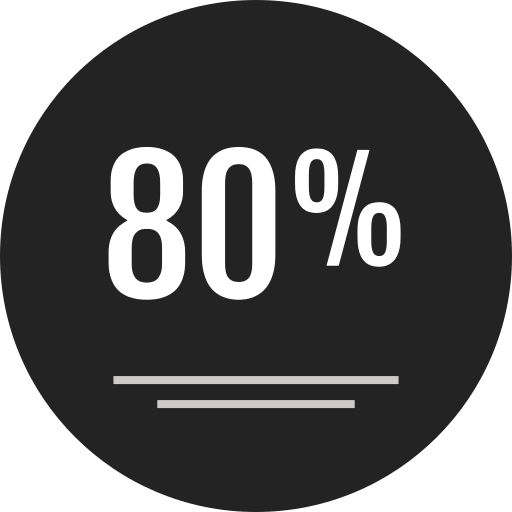
This visually engaging percentage chart effectively represents data distributions and comparisons across different categories. Designed with clarity in mind, it utilizes vibrant colors and distinct segments to highlight varying proportions, making it an ideal tool for presentations, reports, or educational materials. The chart can be easily integrated into infographics, allowing users to convey complex information in a straightforward manner. Its versatility makes it suitable for business analytics, market research, and academic projects, enabling audiences to quickly grasp key insights and trends at a glance.



Part of the
Infographics SVG collection,
in Design.
Download the Dynamic Percentage Chart vector as a ready-to-edit .svg file —
it scales to any size without losing quality and can be recoloured in any
vector editor or straight in CSS.