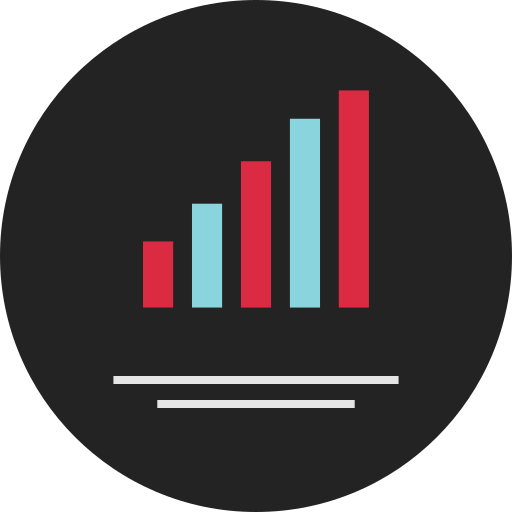
This horizontal bar chart visualization effectively represents comparative data across multiple categories, making it an ideal tool for illustrating trends, performance metrics, or survey results. The design features clearly defined bars that allow for easy interpretation of values, with each bar's length corresponding to its quantitative measure. This chart is particularly useful in business presentations, academic reports, and data analysis, where clarity and accessibility of information are paramount. Its horizontal layout is advantageous for displaying long category names, ensuring that viewers can quickly grasp the insights without confusion. This versatile graphic can be utilized in various contexts, including market research, project management, and educational materials, to enhance understanding and facilitate decision-making.

Part of the
Infographics SVG collection,
in Design.
Download the Horizontal Bar Chart Visualization vector as a ready-to-edit .svg file —
it scales to any size without losing quality and can be recoloured in any
vector editor or straight in CSS.