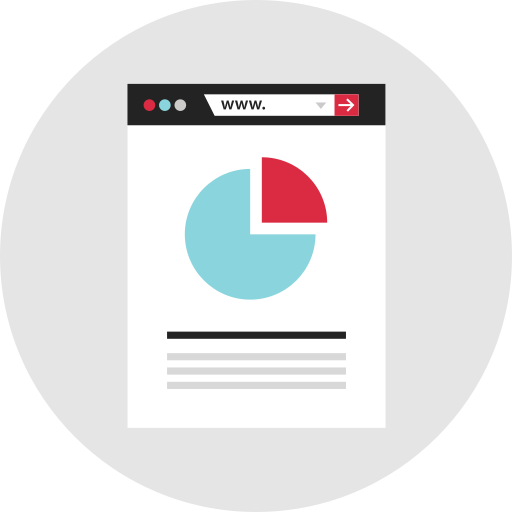
This pie chart visually represents the distribution of various components within an organization, showcasing how different departments or categories contribute to the overall structure. Ideal for presentations, reports, and infographics, this chart can help stakeholders quickly grasp the proportions of resources allocated to each segment. Its clear and colorful design enhances understanding, making it a valuable tool for managers, analysts, and educators aiming to communicate organizational data effectively. Use this graphic to illustrate budget allocations, employee distribution, project focus areas, or any other categorical data relevant to organizational analysis.
Part of the
Infographics SVG collection,
in Design.
Download the Organizational Pie Chart vector as a ready-to-edit .svg file —
it scales to any size without losing quality and can be recoloured in any
vector editor or straight in CSS.