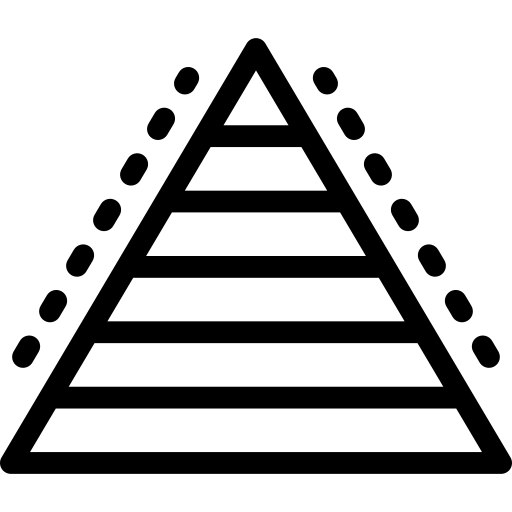
This pyramid chart visualization effectively illustrates hierarchical data, showcasing the relationship between different levels of information. The design features a multi-layered pyramid structure, with each segment representing a distinct category or tier. This chart is particularly useful for displaying concepts such as population distribution, organizational structures, or stages of a process, allowing viewers to easily comprehend the proportions and importance of each level. Ideal for presentations, reports, and educational materials, this graphic serves as a clear and engaging tool for data analysis and communication.


Part of the
Diagrams Schemes SVG collection,
in Business.
Download the Pyramid Chart Visualization vector as a ready-to-edit .svg file —
it scales to any size without losing quality and can be recoloured in any
vector editor or straight in CSS.