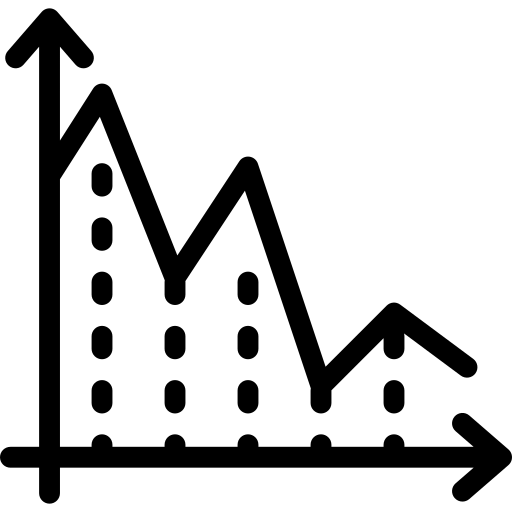
This detailed loss graph visually represents the performance metrics of a system over a specified period, highlighting fluctuations in loss values. It is designed to aid in the analysis of data trends, making it an essential tool for data scientists, analysts, and engineers who are monitoring model performance or system efficiency. The graph features clearly defined axes, indicating time intervals on the x-axis and loss values on the y-axis, allowing for easy interpretation of the data. This image can be utilized in presentations, reports, or academic papers to illustrate the impact of various factors on performance loss, thereby facilitating informed decision-making and strategy development in fields such as machine learning, software development, and operational efficiency.


Part of the
Diagrams Schemes SVG collection,
in Business.
Download the Loss Graph Analysis vector as a ready-to-edit .svg file —
it scales to any size without losing quality and can be recoloured in any
vector editor or straight in CSS.