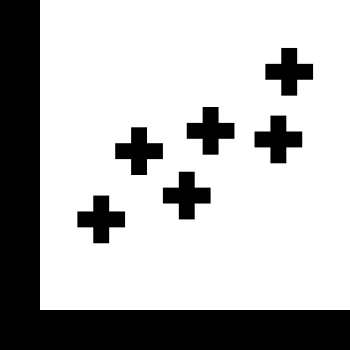
This scatter chart visualization effectively represents the relationship between two quantitative variables, showcasing data points plotted along the X and Y axes. Each point on the chart corresponds to an individual data entry, allowing for the identification of trends, clusters, and outliers within the dataset. Ideal for use in presentations, reports, or educational materials, this graphic can assist analysts and researchers in conveying complex data insights in a clear and visually appealing manner. It is particularly useful in fields such as statistics, business analytics, and scientific research, where understanding correlations and distributions is crucial for decision-making and hypothesis testing.



Part of the
Infographics SVG collection,
in Design.
Download the Scatter Chart Visualization vector as a ready-to-edit .svg file —
it scales to any size without losing quality and can be recoloured in any
vector editor or straight in CSS.