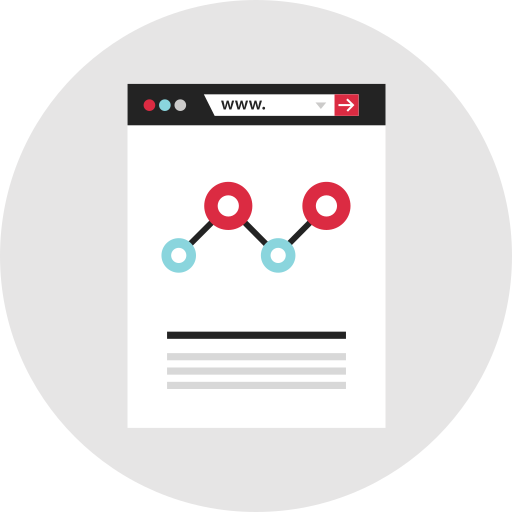
This smooth line chart visualization effectively represents data trends over time, showcasing a continuous flow that highlights key patterns and fluctuations. Ideal for presentations, reports, and infographics, this chart can be utilized in various contexts, including business performance analysis, market research, and academic studies. The clean and professional design ensures clarity, making it suitable for both print and digital media. Users can easily adapt the chart to display different datasets, providing a versatile tool for conveying complex information in an accessible manner.


Part of the
Infographics SVG collection,
in Design.
Download the Smooth Line Chart Visualization vector as a ready-to-edit .svg file —
it scales to any size without losing quality and can be recoloured in any
vector editor or straight in CSS.