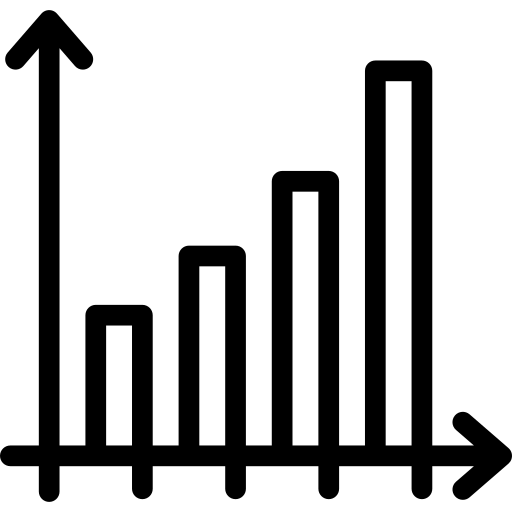
This bar chart graph visually represents quantitative data through rectangular bars, where the length of each bar correlates to the value it represents. Ideal for displaying comparisons among different categories, this graph can effectively highlight trends, differences, and distributions in data sets. It is particularly useful in business presentations, academic reports, and data analysis tasks, allowing viewers to quickly grasp complex information at a glance. The design is clean and professional, making it suitable for various contexts, from corporate meetings to educational settings, where clear communication of data is essential.


Part of the
Diagrams Schemes SVG collection,
in Business.
Download the Bar Chart Graph vector as a ready-to-edit .svg file —
it scales to any size without losing quality and can be recoloured in any
vector editor or straight in CSS.