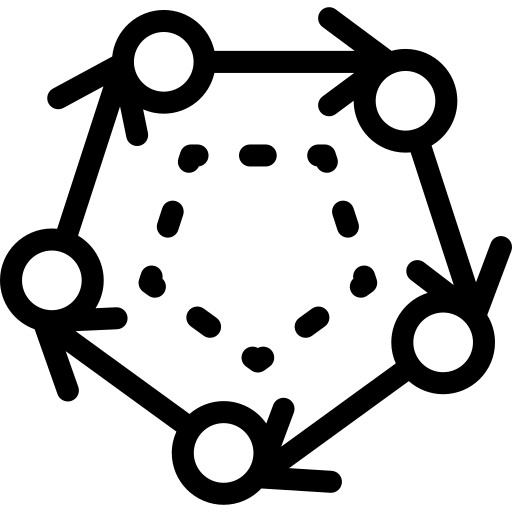
This circular diagram serves as a versatile visual tool for representing data in a clear and engaging manner. It is designed to illustrate relationships, proportions, and comparisons among various elements, making it ideal for presentations, reports, and educational materials. The diagram can effectively convey complex information at a glance, facilitating better understanding and retention for viewers. Its circular format allows for easy segmentation of data points, which can be particularly useful in fields such as business analytics, project management, and academic research. Users can customize the diagram to fit specific themes or color schemes, enhancing its applicability across different contexts and industries.


Part of the
Diagrams Schemes SVG collection,
in Business.
Download the Circular Diagram for Data Representation vector as a ready-to-edit .svg file —
it scales to any size without losing quality and can be recoloured in any
vector editor or straight in CSS.