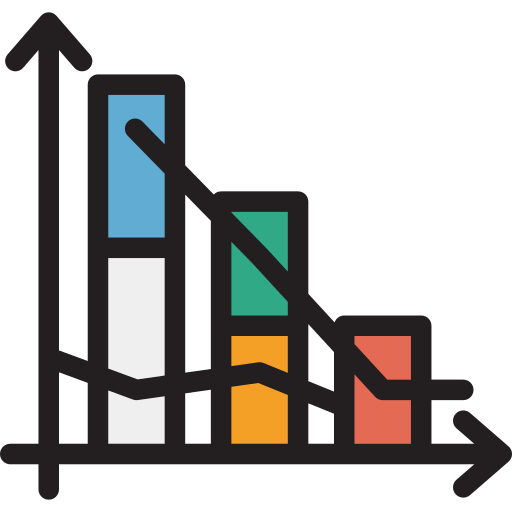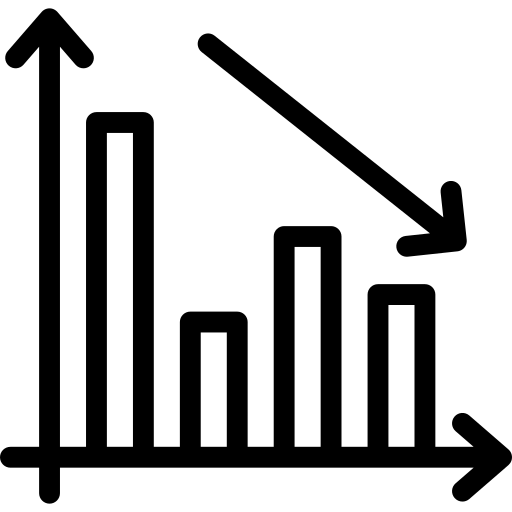
This diagram visually represents a decrease in values or metrics, making it an essential tool for data analysis and presentation. The design incorporates clear arrows and graphical elements that effectively communicate a downward trend or reduction in quantity, which can be applied in various contexts such as financial reports, performance metrics, or statistical analyses. Ideal for use in business presentations, educational materials, or any documentation that requires a succinct visual representation of decline, this image aids in conveying complex information quickly and clearly to the audience.
Part of the
Diagrams Schemes SVG collection,
in Business.
Download the Decrease Indicator Diagram vector as a ready-to-edit .svg file —
it scales to any size without losing quality and can be recoloured in any
vector editor or straight in CSS.