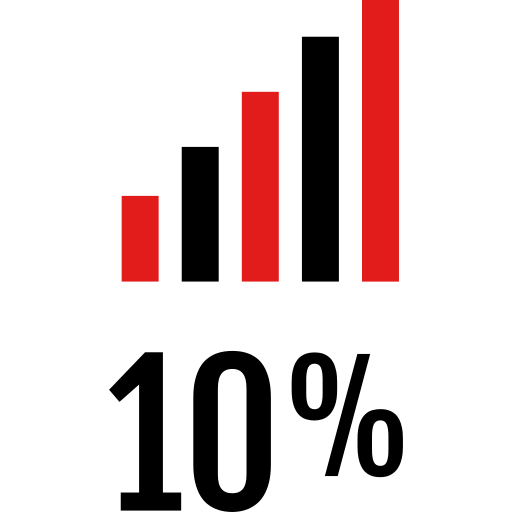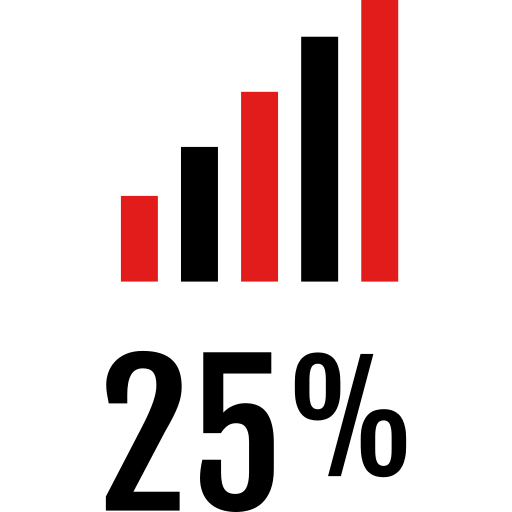
This visual representation showcases a dynamic statistical graph designed to illustrate data trends and comparisons effectively. The graph features multiple data series, allowing for clear differentiation between various metrics. Its vibrant color palette enhances readability and engagement, making it suitable for presentations, reports, and educational materials. The design is versatile, catering to a variety of contexts such as business analytics, academic research, and marketing performance analysis. Users can leverage this graph to communicate complex information in a digestible format, facilitating informed decision-making and strategic planning.


Part of the
Info Graphics Red SVG collection,
in Business.
Download the Dynamic Statistical Graph vector as a ready-to-edit .svg file —
it scales to any size without losing quality and can be recoloured in any
vector editor or straight in CSS.