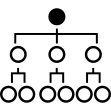
This connected data flow chart visually represents the dynamic interactions and pathways of data within a system. It illustrates how data is collected, processed, and distributed across various components, highlighting the relationships between different data sources and endpoints. The chart is designed to enhance understanding of data analytics processes, making it an essential tool for data scientists, analysts, and business intelligence professionals. Its clear layout and interconnected elements facilitate discussions on data integration, workflow optimization, and system architecture, making it suitable for presentations, reports, and educational materials in the field of data analytics and information technology.



Part of the
Data Analytics SVG collection,
in Technology.
Download the Connected Data Flow Chart vector as a ready-to-edit .svg file —
it scales to any size without losing quality and can be recoloured in any
vector editor or straight in CSS.