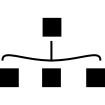
This flow chart interface symbol serves as a visual representation of processes and workflows in data analytics and project management. It features interconnected shapes that denote various steps, decisions, and outcomes, making it an essential tool for illustrating complex systems in a clear and concise manner. Ideal for use in presentations, reports, and software applications, this symbol aids in enhancing understanding and communication of data-driven concepts. Its versatility allows it to be integrated into various contexts, from educational materials to professional documentation, facilitating better engagement and comprehension among audiences.

Part of the
Data Analytics SVG collection,
in Technology.
Download the Flow Chart Interface Symbol vector as a ready-to-edit .svg file —
it scales to any size without losing quality and can be recoloured in any
vector editor or straight in CSS.