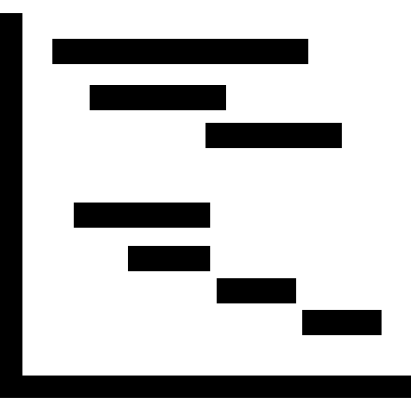
This Gantt chart visualization provides a clear and structured representation of project timelines and task dependencies. It is designed to help project managers and teams track progress, allocate resources, and manage schedules effectively. The chart typically includes horizontal bars that represent the duration of tasks, with the ability to visualize overlapping activities and milestones. This makes it an invaluable tool for planning and monitoring complex projects across various industries, including software development, construction, and event planning. The visual clarity of the Gantt chart aids in communication among stakeholders, ensuring everyone is aligned on project timelines and deliverables.
Part of the
Computer & Media SVG collection,
in Technology.
Download the Gantt Chart Visualization vector as a ready-to-edit .svg file —
it scales to any size without losing quality and can be recoloured in any
vector editor or straight in CSS.