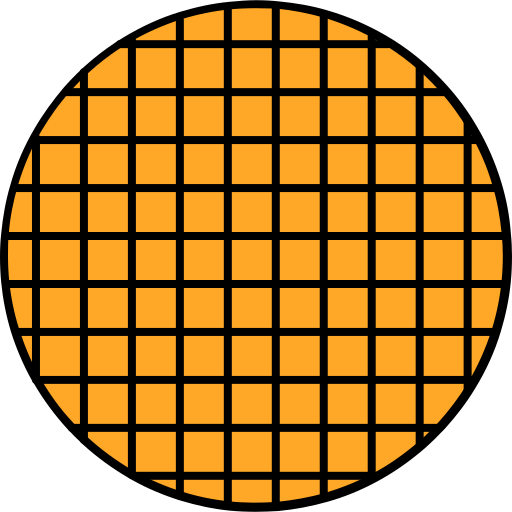
This heat chart visualization effectively represents data intensity across a defined grid, utilizing color gradients to convey varying levels of activity or concentration. Ideal for data analysts and researchers, this chart can be employed in various contexts such as performance metrics analysis, environmental data representation, or customer behavior tracking. The intuitive design allows users to quickly identify trends and anomalies, making it a valuable tool for presentations, reports, and dashboards. Its versatility ensures it can adapt to multiple industries, including healthcare, finance, and marketing, facilitating data-driven decision-making.

Part of the
Database SVG collection,
in Technology.
Download the Heat Chart Visualization vector as a ready-to-edit .svg file —
it scales to any size without losing quality and can be recoloured in any
vector editor or straight in CSS.