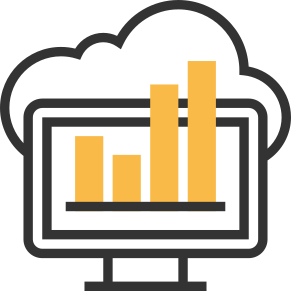
This image presents a comprehensive visualization of network analysis data from the year 2018. It effectively illustrates the relationships and interactions within a network, highlighting key nodes and their connections. The design employs various colors and shapes to differentiate between different types of data points and their significance, making it easier for analysts to interpret complex information. This visualization can be utilized in academic research, business intelligence reports, or presentations to convey insights about network dynamics, trends, and anomalies. It serves as a valuable tool for data analysts, researchers, and decision-makers looking to enhance their understanding of network behaviors and optimize their strategies accordingly.


Part of the
Network SVG collection,
in Technology.
Download the Network Analysis Visualization 92018 vector as a ready-to-edit .svg file —
it scales to any size without losing quality and can be recoloured in any
vector editor or straight in CSS.