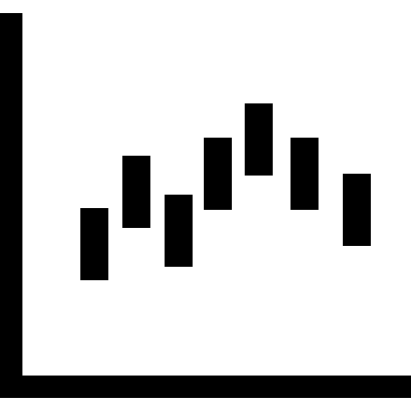
This Renko chart visualization provides a clear and concise representation of price movements in financial markets. Renko charts are unique in that they focus solely on price changes, filtering out the noise of time and volume, which makes them particularly useful for identifying trends and reversals. The chart features distinct bricks that are formed when the price moves a specified amount, allowing traders to assess market momentum and make informed decisions. This visual tool is ideal for financial analysts, traders, and investors who wish to enhance their technical analysis capabilities and develop effective trading strategies. Its clean design and straightforward layout make it suitable for presentations, reports, or educational materials aimed at explaining market dynamics.

Part of the
Computer & Media SVG collection,
in Technology.
Download the Renko Chart Visualization vector as a ready-to-edit .svg file —
it scales to any size without losing quality and can be recoloured in any
vector editor or straight in CSS.