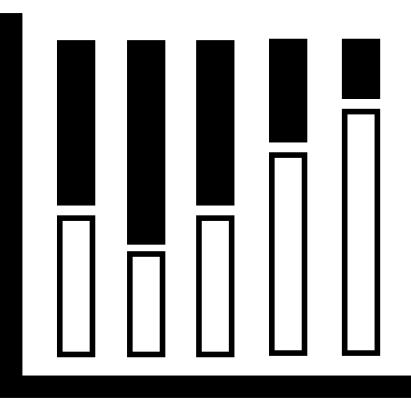
This stacked column chart visualization effectively represents comparative data across multiple categories, allowing for a clear understanding of the composition of each category. The design features distinct segments within each column, showcasing how individual components contribute to the whole. Ideal for presentations, reports, or dashboards, this chart can be used in various fields such as business analytics, education, and research to illustrate trends, performance metrics, or demographic distributions. Its intuitive layout aids in quickly grasping complex data relationships, making it a valuable tool for data-driven decision-making.

Part of the
Computer & Media SVG collection,
in Technology.
Download the Stacked Column Chart Visualization vector as a ready-to-edit .svg file —
it scales to any size without losing quality and can be recoloured in any
vector editor or straight in CSS.